FAQ: Historic AIS data - Beta
Here you will find answers to the most common questions, as well as tips and tricks, related to the AIS data that you can download from this site. The Norwegian Coastal Administration powers this site and data, 100 % open source. In case you do not find the information, have questions related to legal aspects, or need data for other areas, Please contact LOS VTS, Harald Åsheim. In case of technical problems contact Ola Brandt, geodatatjenesten or IKT at the Norwegian Coastal Administration.
General
We can only give out information for vessels we believe to be longer than 45 m. To achieve this we match all messages with various ship registers, as well as information sent out by the AIS from the vessels. To avoid data errors from the AIS, and to gather as much information as possible, we statistically makes this, and therefor need to have quite a time span before we can release data free to public. If you need data now, or data that are more recent in time you need to apply.
We can only give out our own AIS data free. If you need data for other areas, you need to apply.
Data format
You get CSV. Data is semicolon ";" separated with one header line. Decimals denoted with a decimal point ".". CSV is an ordinary text format and opens in whatever text editor of choice. To open in Excel, Please, see own question. Here is a data example:
mmsi;imo_nr;length;date_time_utc;lon;lat;sog;cog;true_heading;nav_status;message_nr
205691000;9687502;180;2016-12-01 09:29:33;7.62178;57.7716;13.6;271.8;276;0;1
205691000;9687502;180;2016-12-01 09:30:45;7.61392;57.7718;12.3;273.5;277;0;3
205691000;9687502;180;2016-12-01 09:31:54;7.60648;57.772;12.9;272.0;275;0;3
Together with the csv data files, you get a "log.txt" file. This file contains your query parameters as well as important information such as potential errors or warnings - check this file carefully!
mmsi: "vessel id"
imo_nr: vessel imonumber as sent out by AIS
length: length in meter derived from AIS message 5 or 19
date_time_utc: date and time in UTC. ISO formatted as YYYY-MM-DD hh:mm:ss
lon: longitude in decimal degrees
lat: latitude in decimal degrees
sog: speed over ground
cog: course over ground
true_heading: Degrees (0-359) (511 indicates "not available" = default)
nav_status: status
message_nr: the message number (1-3 class A, 18 class B)
For further detailed information se for example here.
Sorry, Not here! We cannot give out vessel information from various ship registers. You only get the vessel length and imonumber sent out by the AIS. You need to ‘Google’ or buy access to register data.
Open the data in QGIS
Yes, you can open the data directly in QGIS. Use the QGIS reader "Add Delimited Text Layer".
 Hook of for "Custom delimiters" and use ";". Select "geometry definition" as point. Use the data headings lon and lat as x - field and y - field respectively. Hook of for "First record has field names". Clic OK.
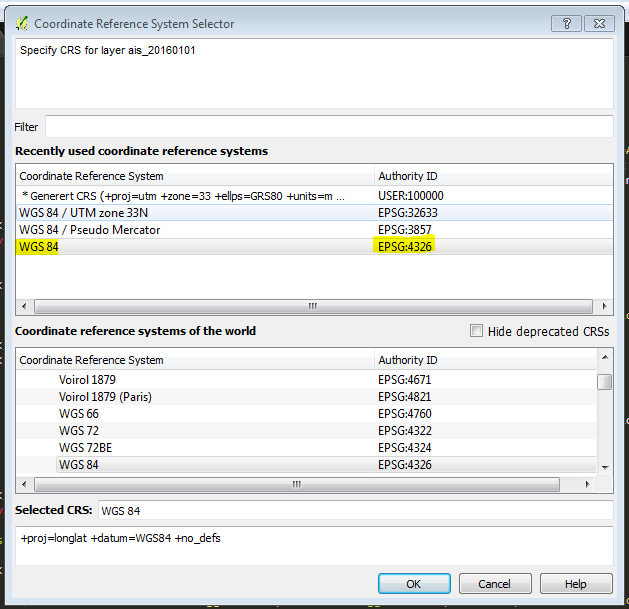
 As coordinate system select EPSG:4326.
Hook of for "Custom delimiters" and use ";". Select "geometry definition" as point. Use the data headings lon and lat as x - field and y - field respectively. Hook of for "First record has field names". Clic OK.
As coordinate system select EPSG:4326.
When downloading data, select sort data by "mmsi, time". That sorts data on first mmsi, and then on time for each mmsi number. Optionally do that afterwards in software of your choice.
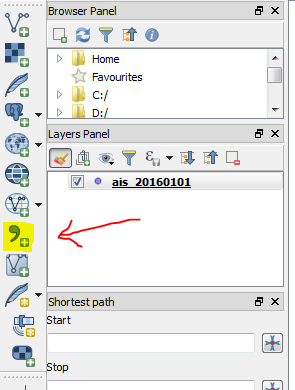
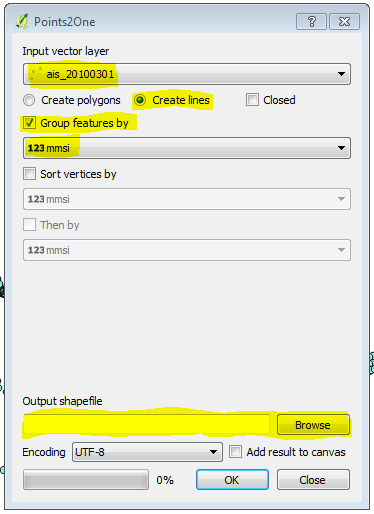
Ok, now read the data into QGIS (se FAQ "How to open the data in QGIS?"). In QGIS go to "plugins>>Manage and install plugins...". Search for "Points2One" and install (unless not already installed...).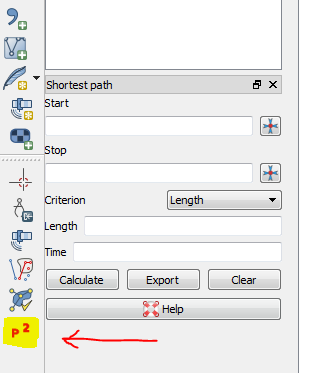 In Points2One select your AIS layer. Select "Create lines" Hook of for "Group features by:" and select "123mmsi". Select where to store the data as shape file(s). Hook of for "Add result to canvas".
Ok, now read the data into QGIS (se FAQ "How to open the data in QGIS?"). In QGIS go to "plugins>>Manage and install plugins...". Search for "Points2One" and install (unless not already installed...).
In Points2One select your AIS layer. Select "Create lines" Hook of for "Group features by:" and select "123mmsi". Select where to store the data as shape file(s). Hook of for "Add result to canvas".
Open the data in Excel
Yes, you can open the data using Excel - But, it is not recommended. It is ok for small data files - but to open GB's of data will just cause trouble. If you anyway want, make sure 1) all attributes are imported as numbers, 2) that you have set decimal separator as point "." not comma ",". If you have not done so, it is very likely that Excel tries to "help" you and interpret data as time or date instead.
Data quality, Understand the data.
YES. You will find loads of errors. Here are a few reasons :
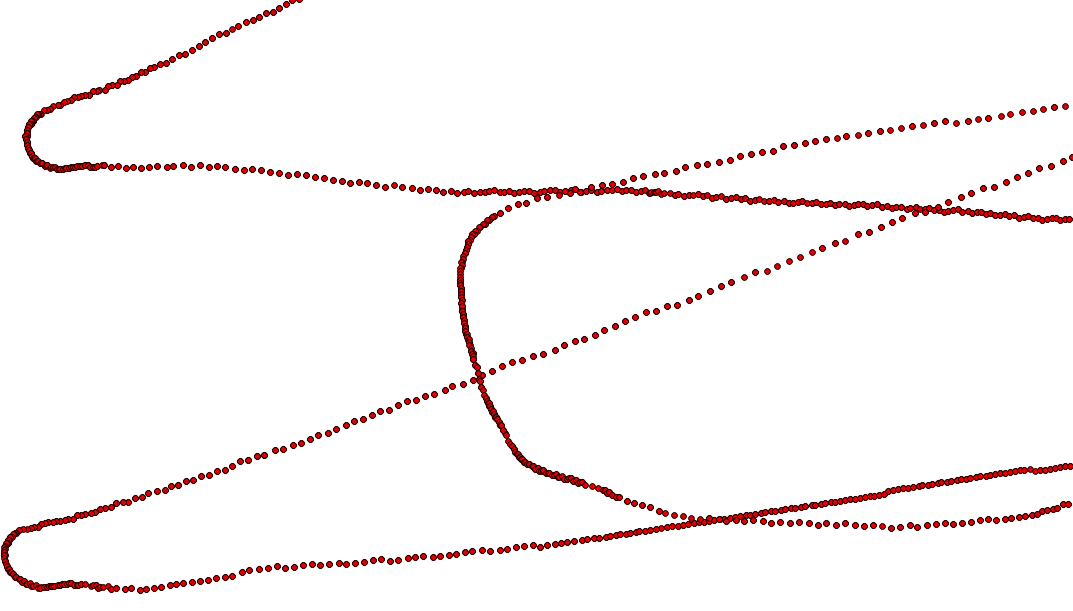
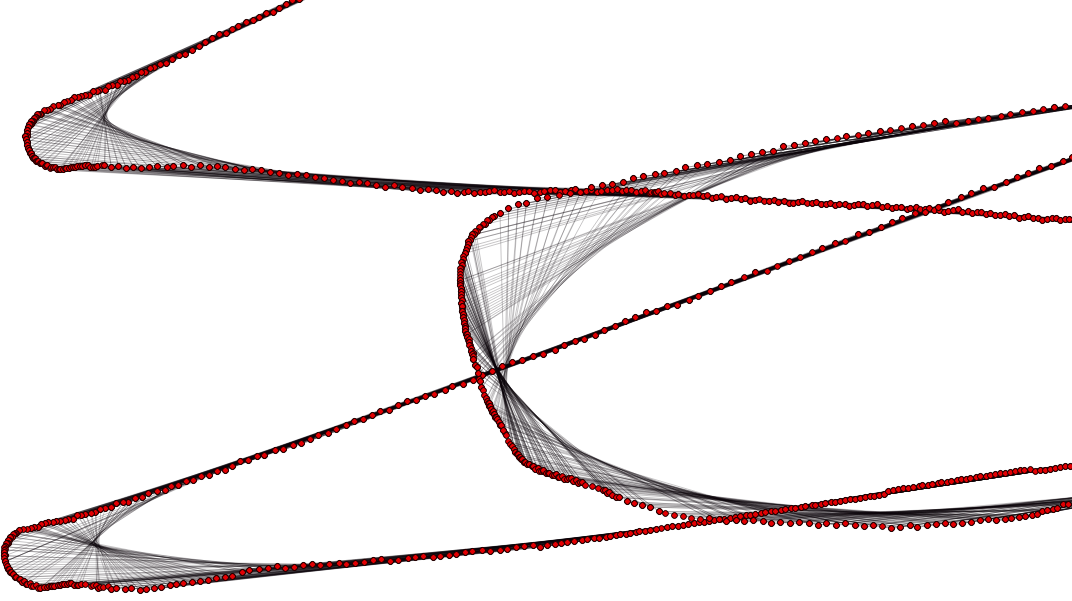 To the left, only points are plotted. Everything looks ok - But the points are actually duplicates. Two (or more!) points are actually on top of each other - but with different timestamp. When the data is sorted by time, and a track is created between the points closest in time, it appears as the vessel has sailed back-and-forth along the track. One base station has in this case logged the very same points but with ~ 5 min delay.
- AIS transponder not setup correctly.
- Instruments on board gives errors or are not hooked up correctly with transponder.
- Users change or modifies the data sent out. For example offset positions, to avoid show correct position or send out fake positions or other information (they manipulate the data sent out by the AIS transponder).
- Error in in transmission.
- Error in storage or decoding.
- The very same message has been received by several base stations and got timestamped with different times. See illustration below.
- Data holes and or variable coverage: The AIS system has been down / out of order, no data coverage. Moved base stations, weather, mountains etc.
- Etc.